In general, the colour coding algorithm consists of four successive stages:
-
Finding the position of the centre of each pore on a micrograph in a Cartesian coordinate system by processing the SEM image of a porous oxide film in the ImageJ software (for more details, see "Statistical Analysis of Images").
- In the resulting array, finding the pore centre coordinates of nearest neighbours for each channel using the Voronoi algorithm.
-
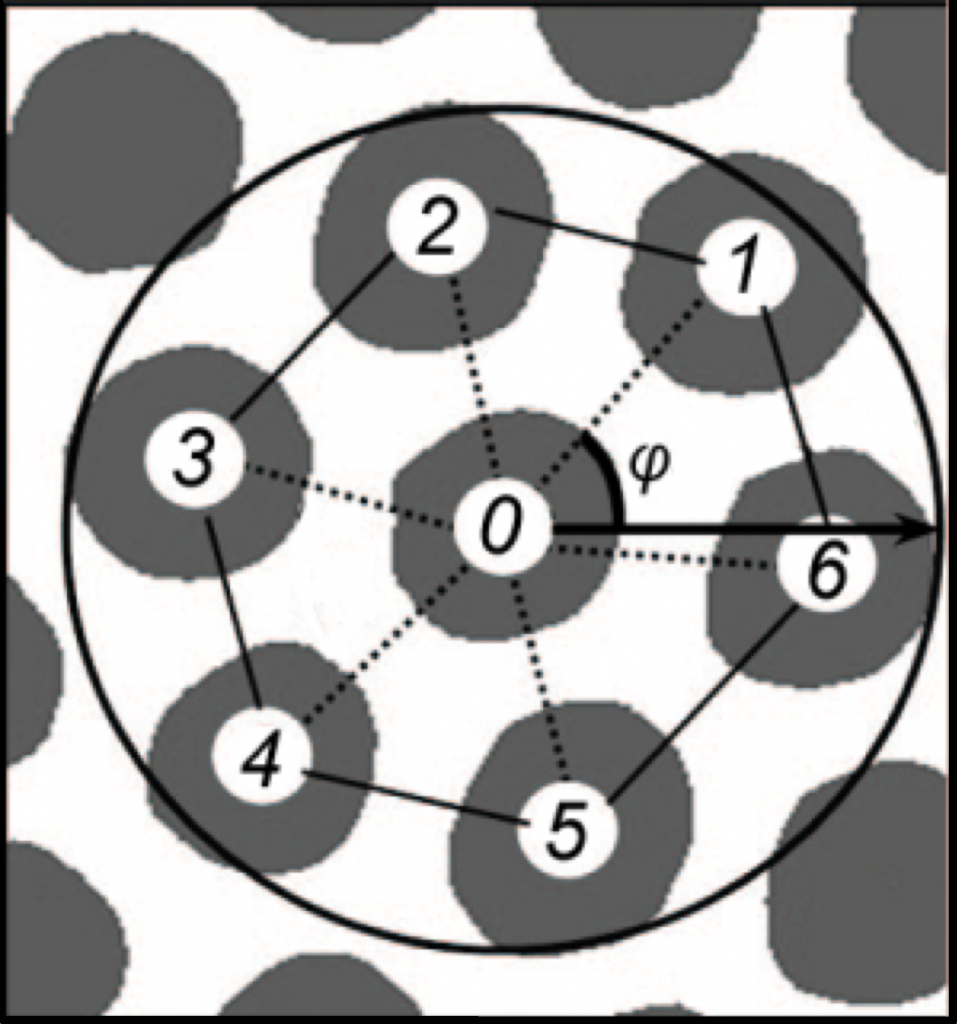
Calculation of the angle φi between the vector connecting the chosen pore with its nearest neighbouring pore from the number found at the previous step and the positive semi-axis of abscissa (see Fig. 1) – the calculated value is transferred to the interval [0°; 60°] by repeatedly adding or subtracting 60° and averaged over all nearest neighbours (value <φ>).
-
Painting the pores in the SEM image, depending on the angle <φ> in accordance with the chosen colour scale.

Figure 1. Determination of the orientation angle φ of a single pore for a cluster consisting of a selected pore and its nearest surrounding [R. Hillebrand et al. // ACS Nano, 2008, v. 2(5), pp. 913–920].
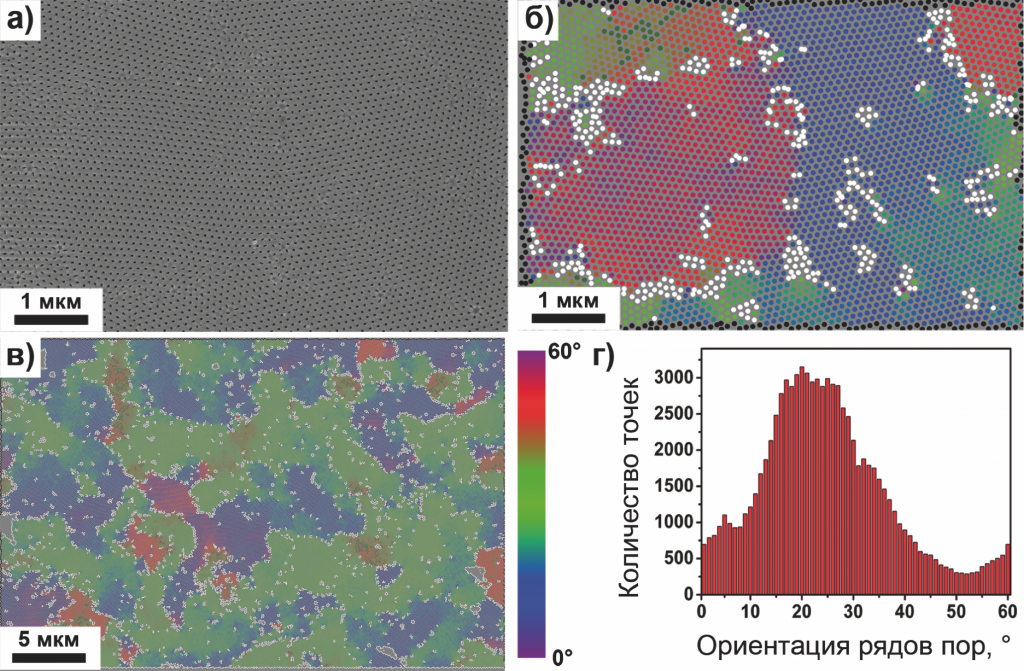
As a result, based on the scanning electron microscopy image, a colour map is formed showing the orientation of the rows of pores in the plane of the oxide film (Fig. 2a, b). The application of this algorithm allows one not only to visualize the domain structure of anodic aluminium oxide, but also to demonstrate defects in hexagonal packing of channels (they are coloured with white in the image).
The application of the color-coding algorithm to SEM images at low magnification (Fig. 2c) makes it possible to visualize the orientational correlations in the structure of anodic aluminium oxide over a large area [K.S. Napolskii et al. // J. Mater. Chem., 2012, v. 22, pp. 11922–11926]. Figure 2c clearly shows the predominance of the green colour of the pore system, which corresponds to <φ>~25° according to the chosen colour scale. The distribution of the orientation of the series of pores for this section is represented in the form of a histogram in Fig. 2d. The image shows a clear maximum. Its position (<φ>) corresponds to the selected direction of the pore system orientation, and the full width at half maximum (FWHM) characterizes the mosaic nature of the porous structure (Δφ).

Figure 2. (a) A SEM image of the bottom surface of the anodic alumina membrane after removal of the barrier layer. (b) SEM image after colour coding – the pores are coloured depending on the average angle of the nearest surrounding pores orientation. Pores that do not have hexagonal surroundings are coloured with white. (c) Low magnification SEM image after colour coding. One can see the presence of a selected direction of pore rows orientation. (d) Pore distribution along the orientation angle for the panel image (c). Illustrations are adopted from [K.S. Napolskii et al. // J. Mater. Chem., 2012, v. 22, pp. 11922–11926].
If you used our program and found it useful, please, cite our work [I.V. Roslyakov, D.S. Koshkodaev, A.A. Eliseev, D. Hermida-Merino, V.K. Ivanov, A.V. Petukhov, K.S. Napolskii. Growth of Porous Anodic Alumina on Low-Index Surfaces of Al Single Crystals // The Journal of Physical Chemistry C, 2017. DOI: 10.1021/acs.jpcc.7b09998] in your scientific papers.

